
Understanding the basics of supply and demand helps you make smarter decisions with your money. Whether you’re shopping for groceries, saving for a big purchase, or trying to understand why prices go up and down, this concept is part of everyday life. While it may sound like something from a high school economics class, supply and demand affects everything from gas prices to housing costs, and knowing how it works can give you a serious advantage.
We're offering a full series of articles like this one on economic concepts in honor of Financial Literacy month and America Saves Week.
If you want to test your knowledge about financial literacy, check out This Financial Literacy Month, Brush Up With Some Test Prep.
At its core, supply and demand describes how much of something is available (supply) and how much people want it (demand). When more people want something and there isn’t enough to go around, prices usually go up. On the other hand, when there’s too much of something and not enough people want it, prices tend to drop.
Think about the last time a new gaming console came out. Everyone wanted it, but stores only had a few. That’s high demand and low supply, which leads to higher prices or long waiting lists. Once supply catches up or demand slows down, prices fall back to normal.
The demand curve is a simple graph that shows the relationship between price and how much people want to buy. On a basic demand graph, the vertical axis (up and down) shows price, while the horizontal axis (left to right) shows quantity demanded.
The demand curve usually slopes downward. That means as prices fall, people are more likely to buy. For example, if movie tickets cost $5 instead of $15, more people are likely to go see a movie. This downward sloping curve illustrates an inverse relationship between price and demand.
If more people want something at the same time, we say that demand increases. For instance, when a popular band announces a reunion tour, concert tickets might sell out in minutes. This shift in demand causes price increases, especially if supply stays the same. This is a great real-world example of supply and demand at work.
A rise in demand can be caused by:
When any of these things happen, the demand curve shifts to the right. That’s a signal that at every price point, people want to buy more of the product.
On the flip side, demand decreases when fewer people want to buy a product, even at the same price. This could happen if:
When demand drops, the demand curve shifts to the left. That shift usually leads to price decreases, as sellers try to encourage people to buy what they’re offering.
Supply refers to how much of a product sellers are willing to offer at different prices. When prices rise, producers are more motivated to supply more. That’s because they can make more money. On the other hand, if prices fall, suppliers may cut back or stop making the product altogether.
For example, if avocado prices jump, farmers may plant more avocado trees. But if prices fall too low, they might switch to growing something else that’s more profitable.
The supply curve is usually upward sloping; as prices increase, the quantity supplied also increases. This curve shows that suppliers are willing to produce more when they can sell at a higher price.
The supply curve shifts based on factors like:
If it becomes easier or cheaper to make a product, supply increases and the curve shifts to the right. If production gets harder or more expensive, supply decreases and the curve shifts to the left.
A demand schedule is a table that shows how many units of a product consumers will buy at different prices. It’s a more detailed version of the demand curve, showing the numbers behind the graph.
Here’s a simple example of a demand schedule for movie tickets:
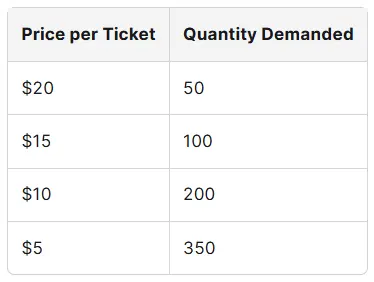
This kind of schedule helps businesses predict how changes in price might affect their sales.
The equilibrium price is the “sweet spot” where supply equals demand. It’s the price at which buyers are happy to purchase the same quantity that sellers are willing to provide. On a supply and demand graph, this point is where the two curves intersect.
If a product is priced above this point, you’ll likely see quantity demanded decreases because people don’t want to pay that much. If the price is too low, quantity supplied might not be enough to meet demand.
Finding the equilibrium point helps balance the market and avoid waste or shortages.
Let’s say gas prices go up. What happens? Some people may cut back on driving, carpool, or switch to public transportation. That’s a decrease in demand. If enough people do this, gas stations might lower prices to encourage more sales. Eventually, the market finds a new equilibrium.
But if a storm disrupts oil production, that limits supply. With less gas available, prices might rise again, even if demand hasn’t changed much.
Price elasticity measures how sensitive demand is to price changes. Some products are very elastic, meaning people stop buying them when prices go up. Other products are inelastic, meaning people will keep buying them no matter what.
For example:
Knowing whether a product has price elasticity helps businesses decide how much they can charge without losing customers.
-min.webp)
You don’t need to be an economist to use supply and demand to your advantage. Understanding when prices fall or rise, and why, helps you:
Knowing when to buy and what drives costs can help stretch your dollar further.
Understanding why demand is important is key to managing your money wisely. If you’re budgeting, investing, or just trying to avoid overspending, demand plays a role in what things cost and when it makes sense to buy. Businesses study demand to set prices, and consumers can use the same knowledge to make better financial decisions.
When demand is high and supply is low, prices often go up. If you know what’s in demand, you can decide to hold off on purchases or shop for alternatives until the market changes. If demand is falling, you might wait for prices to drop further. It’s all part of becoming a more informed consumer.
A demand graph is a visual way to understand consumer behavior. You’ll see price on the vertical axis and quantity demanded on the horizontal axis. This setup shows that as prices rise, the quantity people are willing to buy usually goes down, and vice versa.
Seeing a demand graph can help you picture why a product might be affordable today but more expensive tomorrow. It’s also a great way to explain how sales and discounts influence consumer habits.
The law of demand says that as prices drop, people buy more. This plays out all around us—Black Friday sales, clearance racks, BOGO offers. These promotions lower prices, so customers respond by purchasing more than they usually would.
On the flip side, if prices rise too much, people cut back. That’s why we see big changes in behavior when gas prices spike or grocery bills go up. People may drive less, cook at home, or skip extras to stay within budget.
Several factors can shift demand up or down, including:
These non-price determinants of demand can cause changes even when prices stay the same. For example, if a celebrity endorses a product, demand might soar even if the price doesn’t change.
This is why some products become must-haves overnight, even without any change in cost.
Demand elasticity helps us understand how price-sensitive a product is. If demand drops a lot when the price goes up, we call that product “elastic.” If demand barely changes, it’s “inelastic.”
Here’s how that breaks down in real-world examples:
As a smart shopper, knowing about price elasticity helps you spot where you can cut back if money gets tight. You can skip elastic items more easily when prices rise, while planning ahead for inelastic costs you can’t avoid.
While the demand schedule tells us how much consumers will buy at different prices, the supply schedule shows how much producers are willing to sell at those prices.
Let’s compare the two:
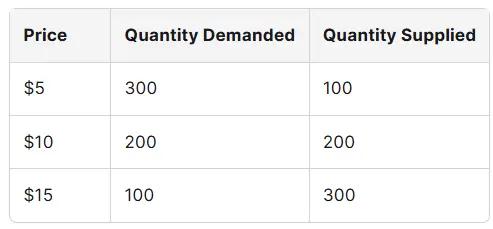
At $10, demand equals supply, so that’s the equilibrium point. Below that, demand is greater than supply. Above that, supply is greater than demand.
These schedules are tools that businesses and economists use to track what’s going on in the market, but they also help consumers know when to expect prices fall or rise based on market trends.
What happens when supply increases? When businesses produce more of a product—whether because of better technology, more materials, or falling production costs—supply goes up. This often causes prices to drop.
If you see supply increases, it’s a good time to buy. For example, during harvest season, grocery stores have more fruits and vegetables, so prices go down. This is a direct effect of supply and demand in action.
Learning how inflation works can also help you understand why prices sometimes rise even when supply is steady.
Equilibrium quantity is the amount of product sold when supply equals demand. It’s not just a number; it reflects the balance of the market. If sellers bring too much to the table and buyers aren’t interested, inventory builds up. If they bring too little, shelves empty too quickly, and people go without.
Knowing how this balance works helps consumers recognize when a deal is fair, or when a price is artificially high or low. You don’t have to memorize the term; just think of it as the point where the system works best for everyone.
Markets don’t always start in balance. But over time, prices and supply adjust to reach market equilibrium. If there’s too much of a product and it doesn’t sell, retailers may offer discounts. If there’s a shortage, prices might climb until enough people stop buying.
You’ve seen this play out if you’ve ever watched a hot holiday toy go from $30 to $300 on resale sites, only to drop back down in January when everyone has moved on. That’s supply and demand finding its way back to equilibrium.
When we say demand describes consumer behavior, we mean it shows how people react to price and availability. It isn’t just a figure on a chart; it reflects people’s needs, preferences, and budgets.
That’s why demand is always changing. A good example is during the pandemic when demand shifted toward cleaning supplies, masks, and home exercise equipment. Those weren’t seasonal trends or price-driven changes; they reflected changing consumer priorities.
A decrease in supply can lead to big changes in price and demand. When there are fewer goods to go around, people often compete to get what’s left. That leads to higher prices, even if demand stays the same.
Supply might decrease due to:
If you understand how supply constraints work, you’re less likely to be caught off guard when prices spike. You may even be able to plan ahead and avoid buying during the most expensive periods.
If you’re focused on your financial goals, like building an emergency fund, supply and demand can be part of your strategy.
By buying when prices fall, avoiding hot-demand items, and anticipating market price changes, you can:
These small decisions, guided by supply and demand, can add up to long-term savings.
Different demand states exist in the market:
These states influence everything from how products are advertised to how businesses plan for the future. As a consumer, being aware of where a product stands can help you decide when to buy or wait.
This article is part of a broader effort to promote education during Financial Literacy Month. Understanding supply and demand is more than just textbook theory; it’s a skill you can use every time you spend, save, or invest.
If you’re ready to take action on your financial knowledge, consider reading more about basics of investing or explore how interest rates affect your finances.
Understanding supply and demand isn’t just for economists; it plays out in real-world situations every day. When you see empty shelves at the store or unusually high prices online, that’s often because demand has outpaced supply. On the other hand, clearance sales happen when supply is too high and sellers need to offload excess inventory.
As a consumer, paying attention to these patterns helps you make smarter choices. For example, if you notice a product’s price rising steadily, it might mean that demand is increasing or supply is tightening. Either way, you can decide whether to buy now or wait for prices to drop.
Market price is the current price a product sells for in a competitive marketplace. It’s determined by what buyers are willing to pay and what sellers are willing to accept. If there’s strong demand and not enough supply, the market price will rise. If too many sellers flood the market with goods no one wants, the market price drops.
In a healthy economy, market prices fluctuate in response to changes in supply and demand. These shifts help balance what’s available with what people want, and they help you as a shopper decide what’s worth your money.
A demand increase can shake up a market. Think about when a new smartphone launches. People rush to buy it, and demand skyrockets. Even though supply may be the same as last year’s model, the new demand pushes the price up. This increase causes the demand curve to shift to the right, meaning that at every price level, more people want the product.
Eventually, companies may respond by producing more to match the new demand, moving the market toward a new equilibrium price. Until that happens, consumers often face higher prices, longer wait times, or limited availability.
Markets are constantly adjusting. When prices rise because of higher demand, they don’t always stay high. If consumers stop buying or cheaper alternatives come along, demand drops and prices may start to fall.
For example, a popular brand of sneakers might sell out immediately at launch. Resellers can charge double the original price. But after a few weeks, when excitement cools or the store restocks, prices fall back to normal. This is a classic demonstration of how supply and demand adjust over time.
Price changes influence how people shop. If something costs too much, many people wait for a sale or switch to another brand. This kind of flexibility is part of what makes demand elastic. Businesses know this and often run promotions to stimulate sales when demand slows.
The concept of price changes is also useful when budgeting. Recognizing which goods are likely to fluctuate in price helps you plan. For instance, seasonal items—like winter coats or swimsuits—often follow predictable demand patterns.
Quantity supplied is the amount of a good that producers are willing to sell at a specific price. If a company can make more money by selling at a higher price, it may choose to increase supply. But if production costs are too high or if there’s less demand, they may cut back.
This dynamic is especially visible in industries like agriculture, where weather and seasonality play a major role. If a drought limits how many crops can be harvested, the quantity supplied decreases and prices go up. Understanding this can help you recognize when rising prices are part of a broader trend.
Let’s take a moment to understand the structure of a demand graph. The vertical axis shows the price of a good, while the horizontal axis shows how much of the good consumers will buy at each price.
These two axes help visualize key relationships:
Together, these axes allow us to graph a demand curve, which usually slopes downward. This downward slope shows that as price increases, demand typically falls.
The entire demand curve shows all of the potential price and quantity combinations in a given market. It’s not just one point or sale; it’s the big picture.
When factors like income, population size, or tastes shift, the entire demand curve moves. A curve that moves to the right indicates a demand increase. A shift to the left signals a drop in demand. These shifts can occur even if price stays the same, thanks to non-price determinants like public trends or economic changes.
This is why financial literacy means understanding more than just prices; it’s about how outside forces change our financial environment.
We’ve already seen that demand describes how people respond to price, but it also shows behavior. Demand reflects how willing and able people are to purchase goods and services, and it changes based on many factors.
For instance, during inflation, even if people want a product, they may cut back if their income doesn’t stretch as far. So demand reflects not just desire, but also the purchasing power of consumers.
Understanding this gives you a clearer view of how economic trends like inflation affect your household budget.
It’s common for people to react differently at different prices. Someone might buy a cup of coffee every day at $2, but only once a week if it jumps to $5. This change in behavior based on price is central to demand theory.
Retailers know this and often use price decreases to stimulate purchases. Flash sales, coupons, and discount apps all work by adjusting prices just enough to boost demand. You can use the same logic to time your own purchases and save money.
It’s important to distinguish between a change in quantity demanded and an increase in demand:
The former is movement along the demand curve, while the latter is a shift of the entire curve. Knowing the difference helps you understand how to interpret market signals.
Suppliers can exist in different supply states depending on how they respond to market conditions:
Recognizing these states helps you understand what kind of market you’re shopping in. If it’s overstocked, you may find great deals. If it’s understocked, it might be better to wait unless the product is urgent.
When supply and demand balance each other out, we reach market equilibrium. This is when the quantity of goods consumers want to buy equals the quantity sellers want to offer. It’s a key concept that keeps the marketplace running smoothly.
Why does it matter to you? When a market is in equilibrium:
Even if you’re not studying economics, understanding how this balance works can help you avoid overpaying and recognize when a price is fair.
Though they’re related, there’s a small difference between the equilibrium point and the equilibrium price.
Both represent the same idea, that the market has found a fair value for the product. But it’s important to understand these terms separately when reviewing charts, news articles, or budgeting tools.
Financially literate consumers can use knowledge of supply and demand to stretch their money further. For example:
This kind of behavior leads to better money habits and smarter decisions, especially when paired with other tools like savings challenges or goal-setting pledges.
A supply curve shift means something other than price has changed supply. For example, if new technology makes it cheaper to produce solar panels, companies can produce more at every price point. This shifts the supply curve to the right, often leading to price drops.
On the other hand, if a global shortage affects a major material, supply might fall, shifting the curve left. Recognizing these shifts—especially during newsworthy events—helps you anticipate changes at the cash register.
Marginal utility refers to the additional satisfaction you get from consuming one more unit of a product. When you eat one slice of pizza, it’s great. The second is still good. By the fourth or fifth, you’re full, and it’s not as satisfying.
As marginal utility declines, people are less likely to keep buying more, even if the price is low. This helps explain why demand doesn’t grow forever. Businesses use this knowledge to package products in smaller quantities or create variety packs to maintain interest.
Purchasing power is how much your money can buy. If prices rise faster than wages, your purchasing power falls. That means you’ll probably buy less, even if your income hasn’t changed.
This is why inflation hits hard for everyday consumers. Even if demand hasn’t changed, your ability to act on that demand has. Understanding this helps explain why the economy can slow down, even when people still want products and services.
Not every demand change is a demand drop. Sometimes, demand shifts to other products rather than going away entirely.
Example: When gas prices rise, people might buy fewer gas-powered cars and more electric vehicles. That’s not a drop in demand; it’s a shift. Knowing how to spot these shifts helps you make better long-term decisions, especially for big purchases.
As part of Financial Literacy Month, we want to help you build confidence around topics that may have once seemed too complex. Understanding how demand, supply, and price changes affect your daily life is part of being an informed, empowered consumer.
Whether you’re planning to save more, reduce spending, or prepare for inflation, knowing how the market behaves is a key step. The more you know about how demand works, the more control you’ll have over your personal finances.
If you’re looking for more practical knowledge, try learning about the basics of currency or explore how taxes work in everyday life.
You don’t need to memorize graphs or definitions to benefit from this knowledge. You just need to observe the world around you:
Knowing when to spend, save, or wait is one of the most useful financial skills. Supply and demand aren’t just classroom concepts; they’re tools to help you build a stronger financial future.
Keep coming back for more financial literacy month material. And contact us any time to talk to a certified counselor for free credit counseling and debt advice.


